by Steve Gifford | Aug 7, 2024 | Terrier
In the Terrier SDK’s web version, we heavily use Web Assembly. It powers the real-time data rendering we rely on and lets us share that code between web and mobile. What is Web Assembly? Web Assembly, WASM, for short, is very exciting in a very boring way....
by Steve Gifford | Jul 31, 2024 | Terrier
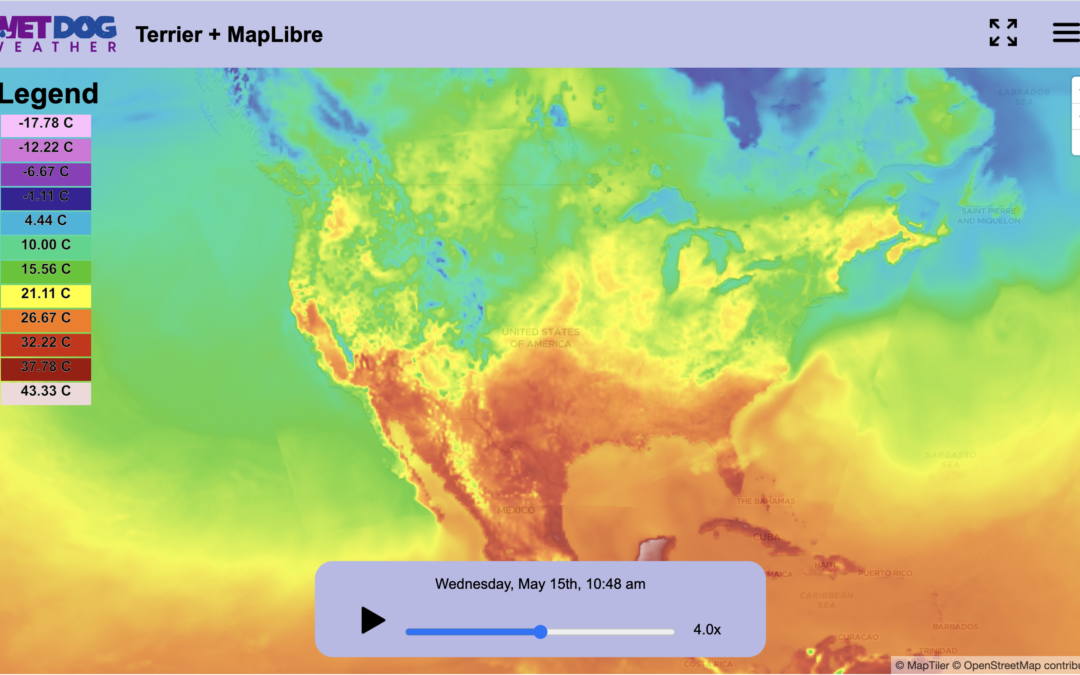
The image above showcases the default weather dashboard integration we provide to new customers with the Terrier SDK. While we use this dashboard for debugging weather stacks, it’s important to note that you’re not locked into this specific configuration....
by Steve Gifford | Jul 17, 2024 | Boxer, Terrier
Most weather practitioners have a degree in meteorology, atmospheric science, or something similar. Sales, marketing, and even software developers often share that background. However, that’s not how I got into weather app development. Years ago, my company at...
by Steve Gifford | Jun 27, 2024 | Data, Terrier
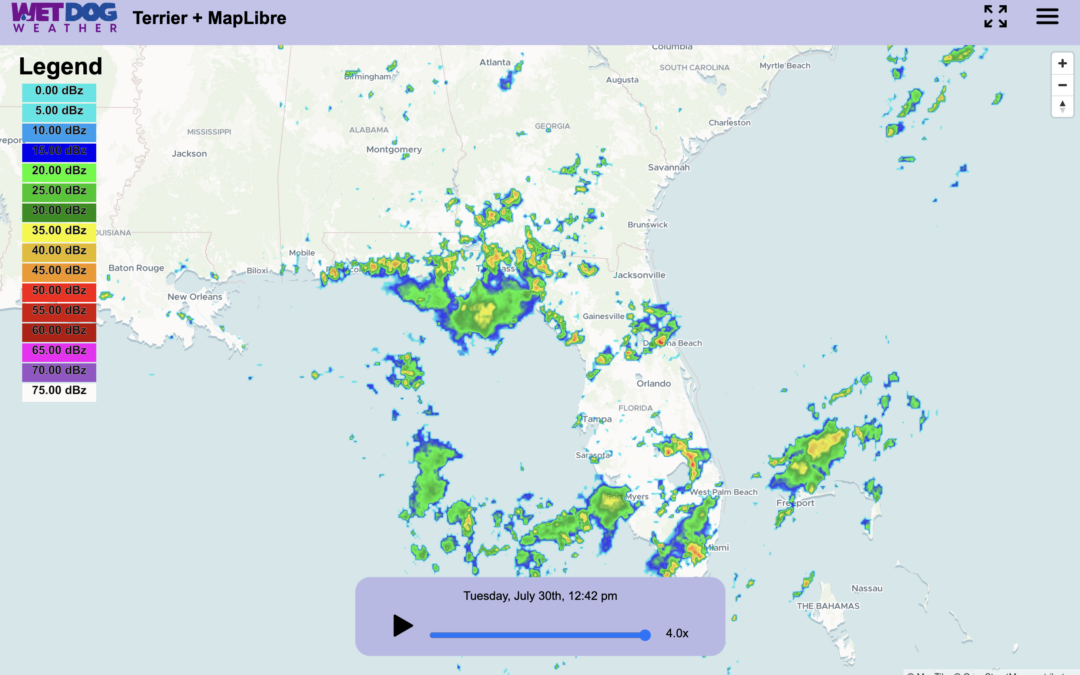
At Wet Dog Weather, we have our own web and mobile display technology called Terrier. It’s crazy good, and we love it! However, we understand that sometimes you need to support the old way of doing things, which is why we also support traditional web mapping...
by Steve Gifford | Jun 20, 2024 | Terrier
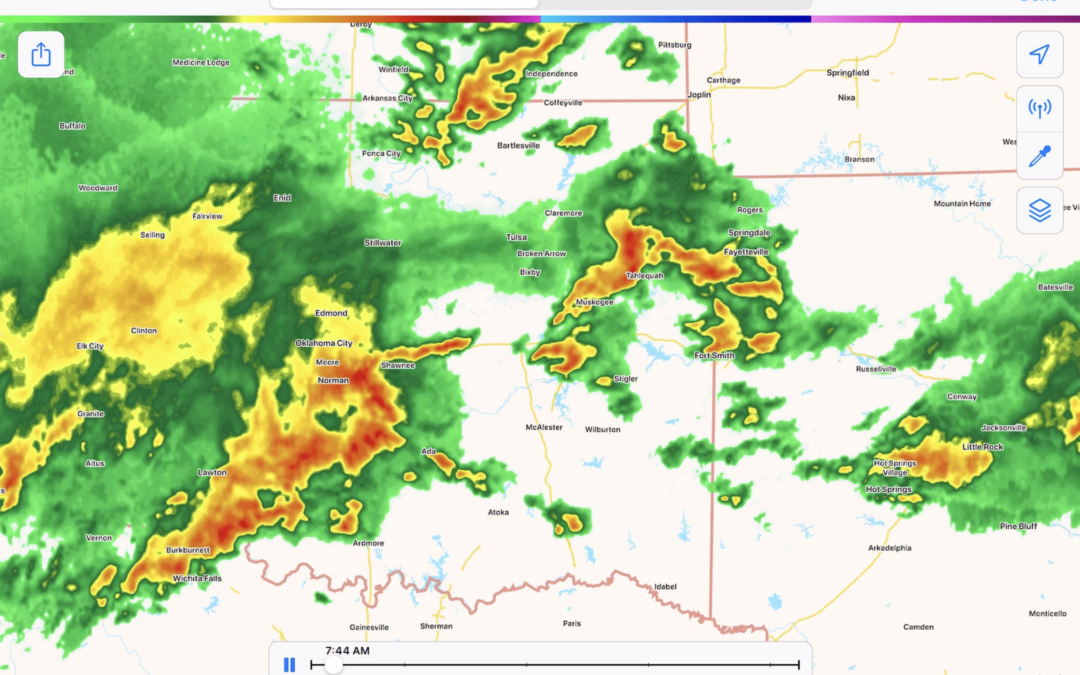
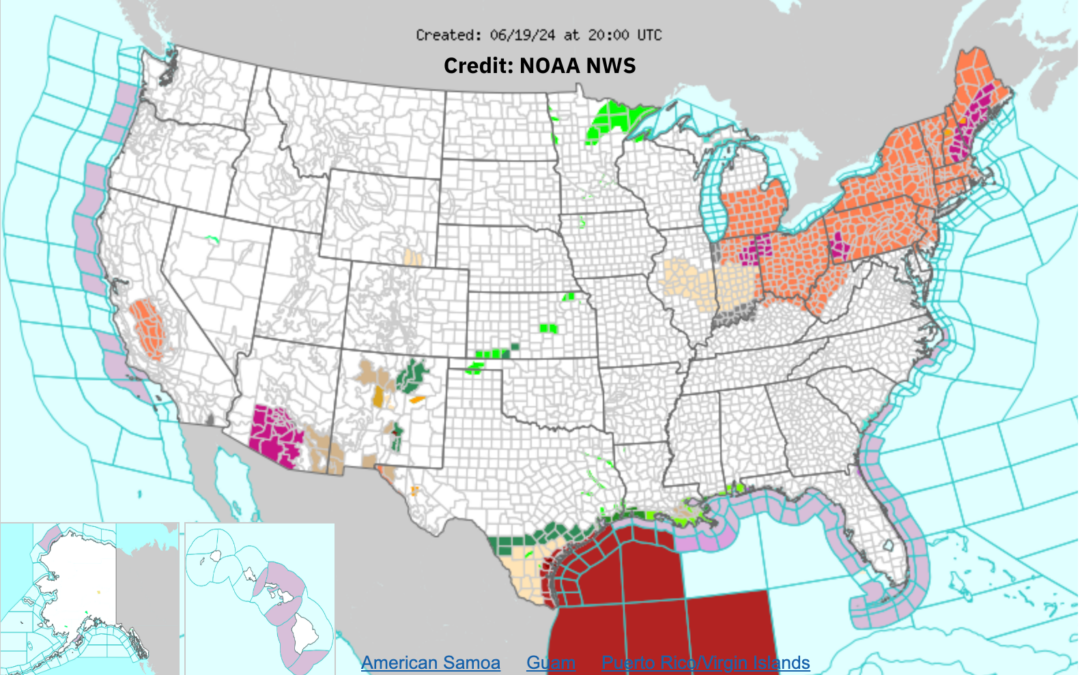
At Wet Dog Weather, we’ve primarily dealt with gridded models and observed data, but we’re now expanding our focus to include weather alerts. Our current data sources include GFS, HRRR, RTMA, and high-resolution models provided by and for our customers. We...
by Steve Gifford | Jun 12, 2024 | MapLibre, Terrier
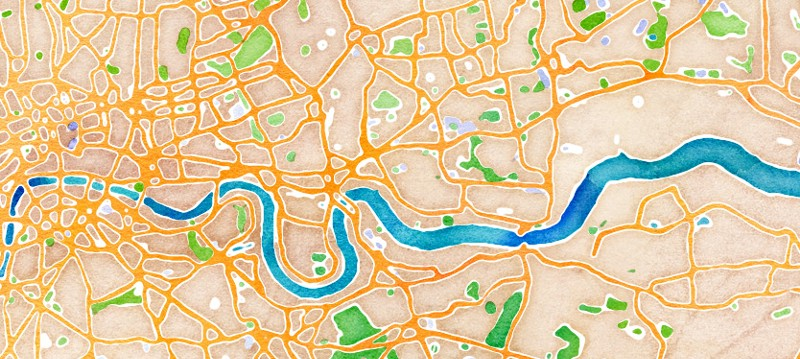
I was recently asked how to do Stamen Watercolor in MapLibre at the State of the Map in Salt Lake City after a talk about Stadia & Stamen’s recent revival of the old Stamen styles. Except Watercolor. There are ways you could hack it at the app level, but a...