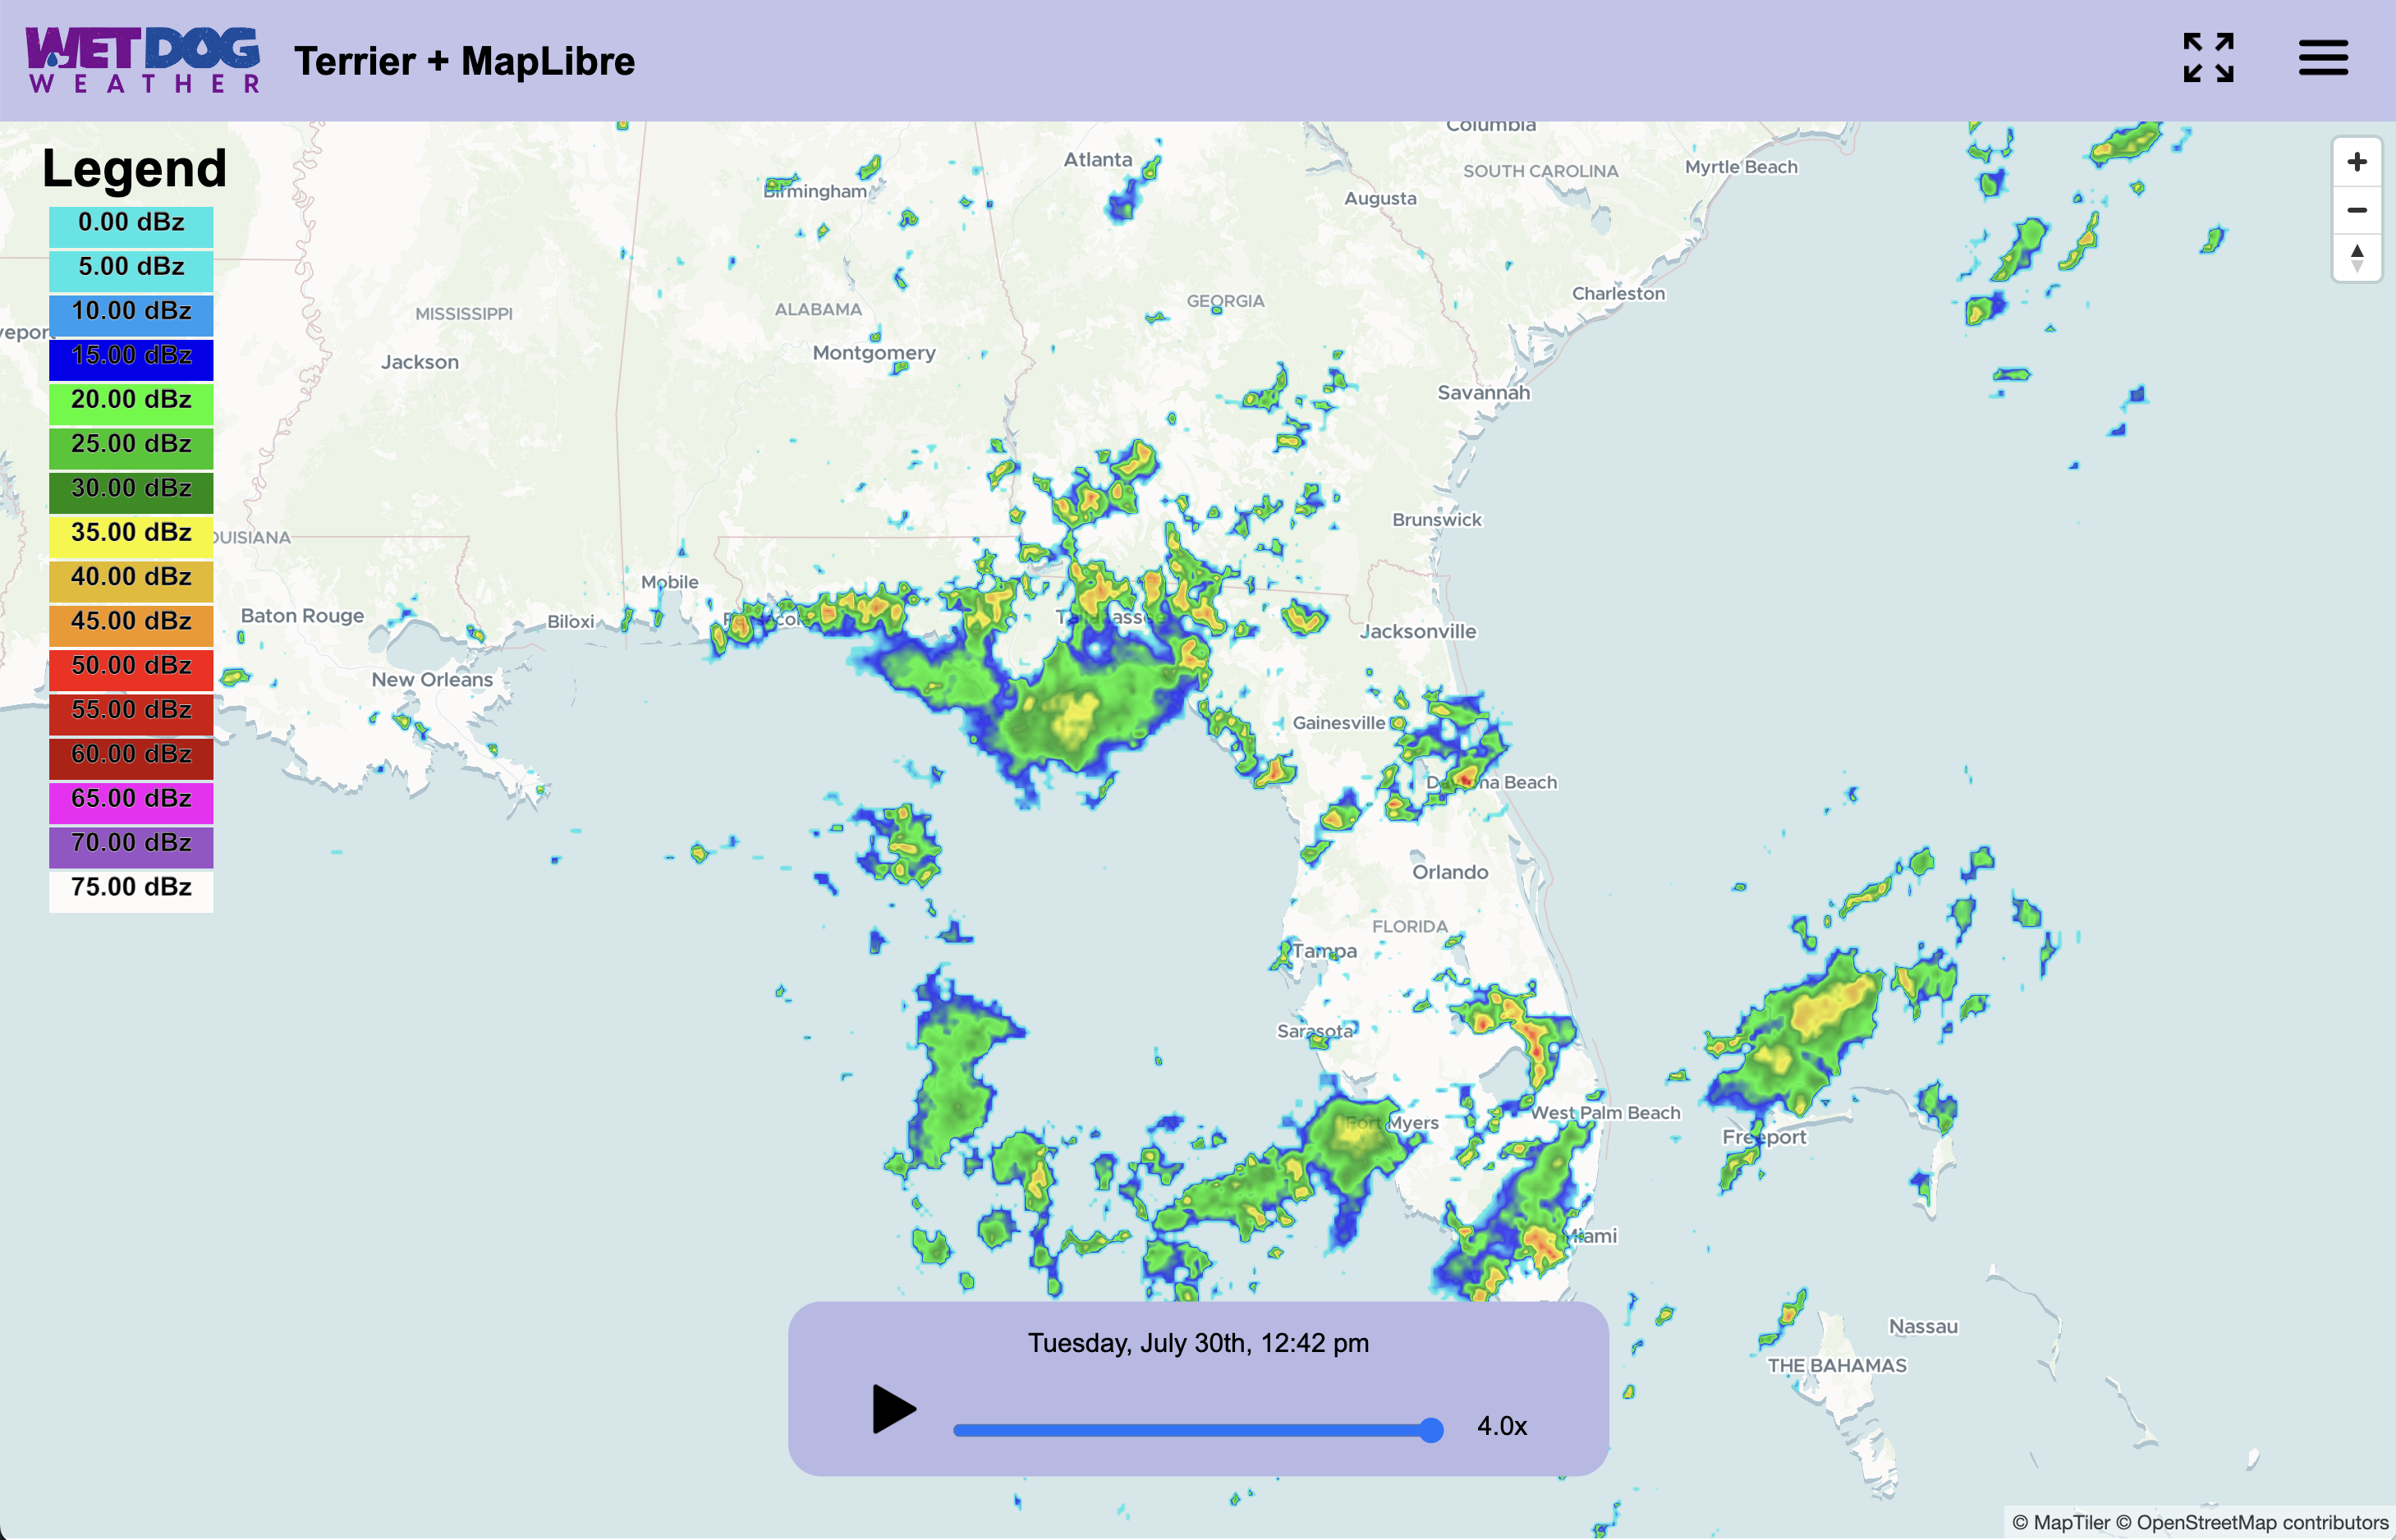
The image above showcases the default weather dashboard integration we provide to new customers with the Terrier SDK. While we use this dashboard for debugging weather stacks, it’s important to note that you’re not locked into this specific configuration.
Let’s clarify a key point: this dashboard is not Terrier itself. Instead, it’s a React app that utilizes the Terrier Web SDK as a component. This flexible approach to weather dashboard integration means you can use our dashboard whole, in part, or disregard it entirely to create your custom solution.
Weather Dashboard Integration: Customizing Your Terrier Experience
Regarding weather dashboard integration, the base map is a crucial element. In this example, we’re using MapLibre to render a base map from MapTiler.
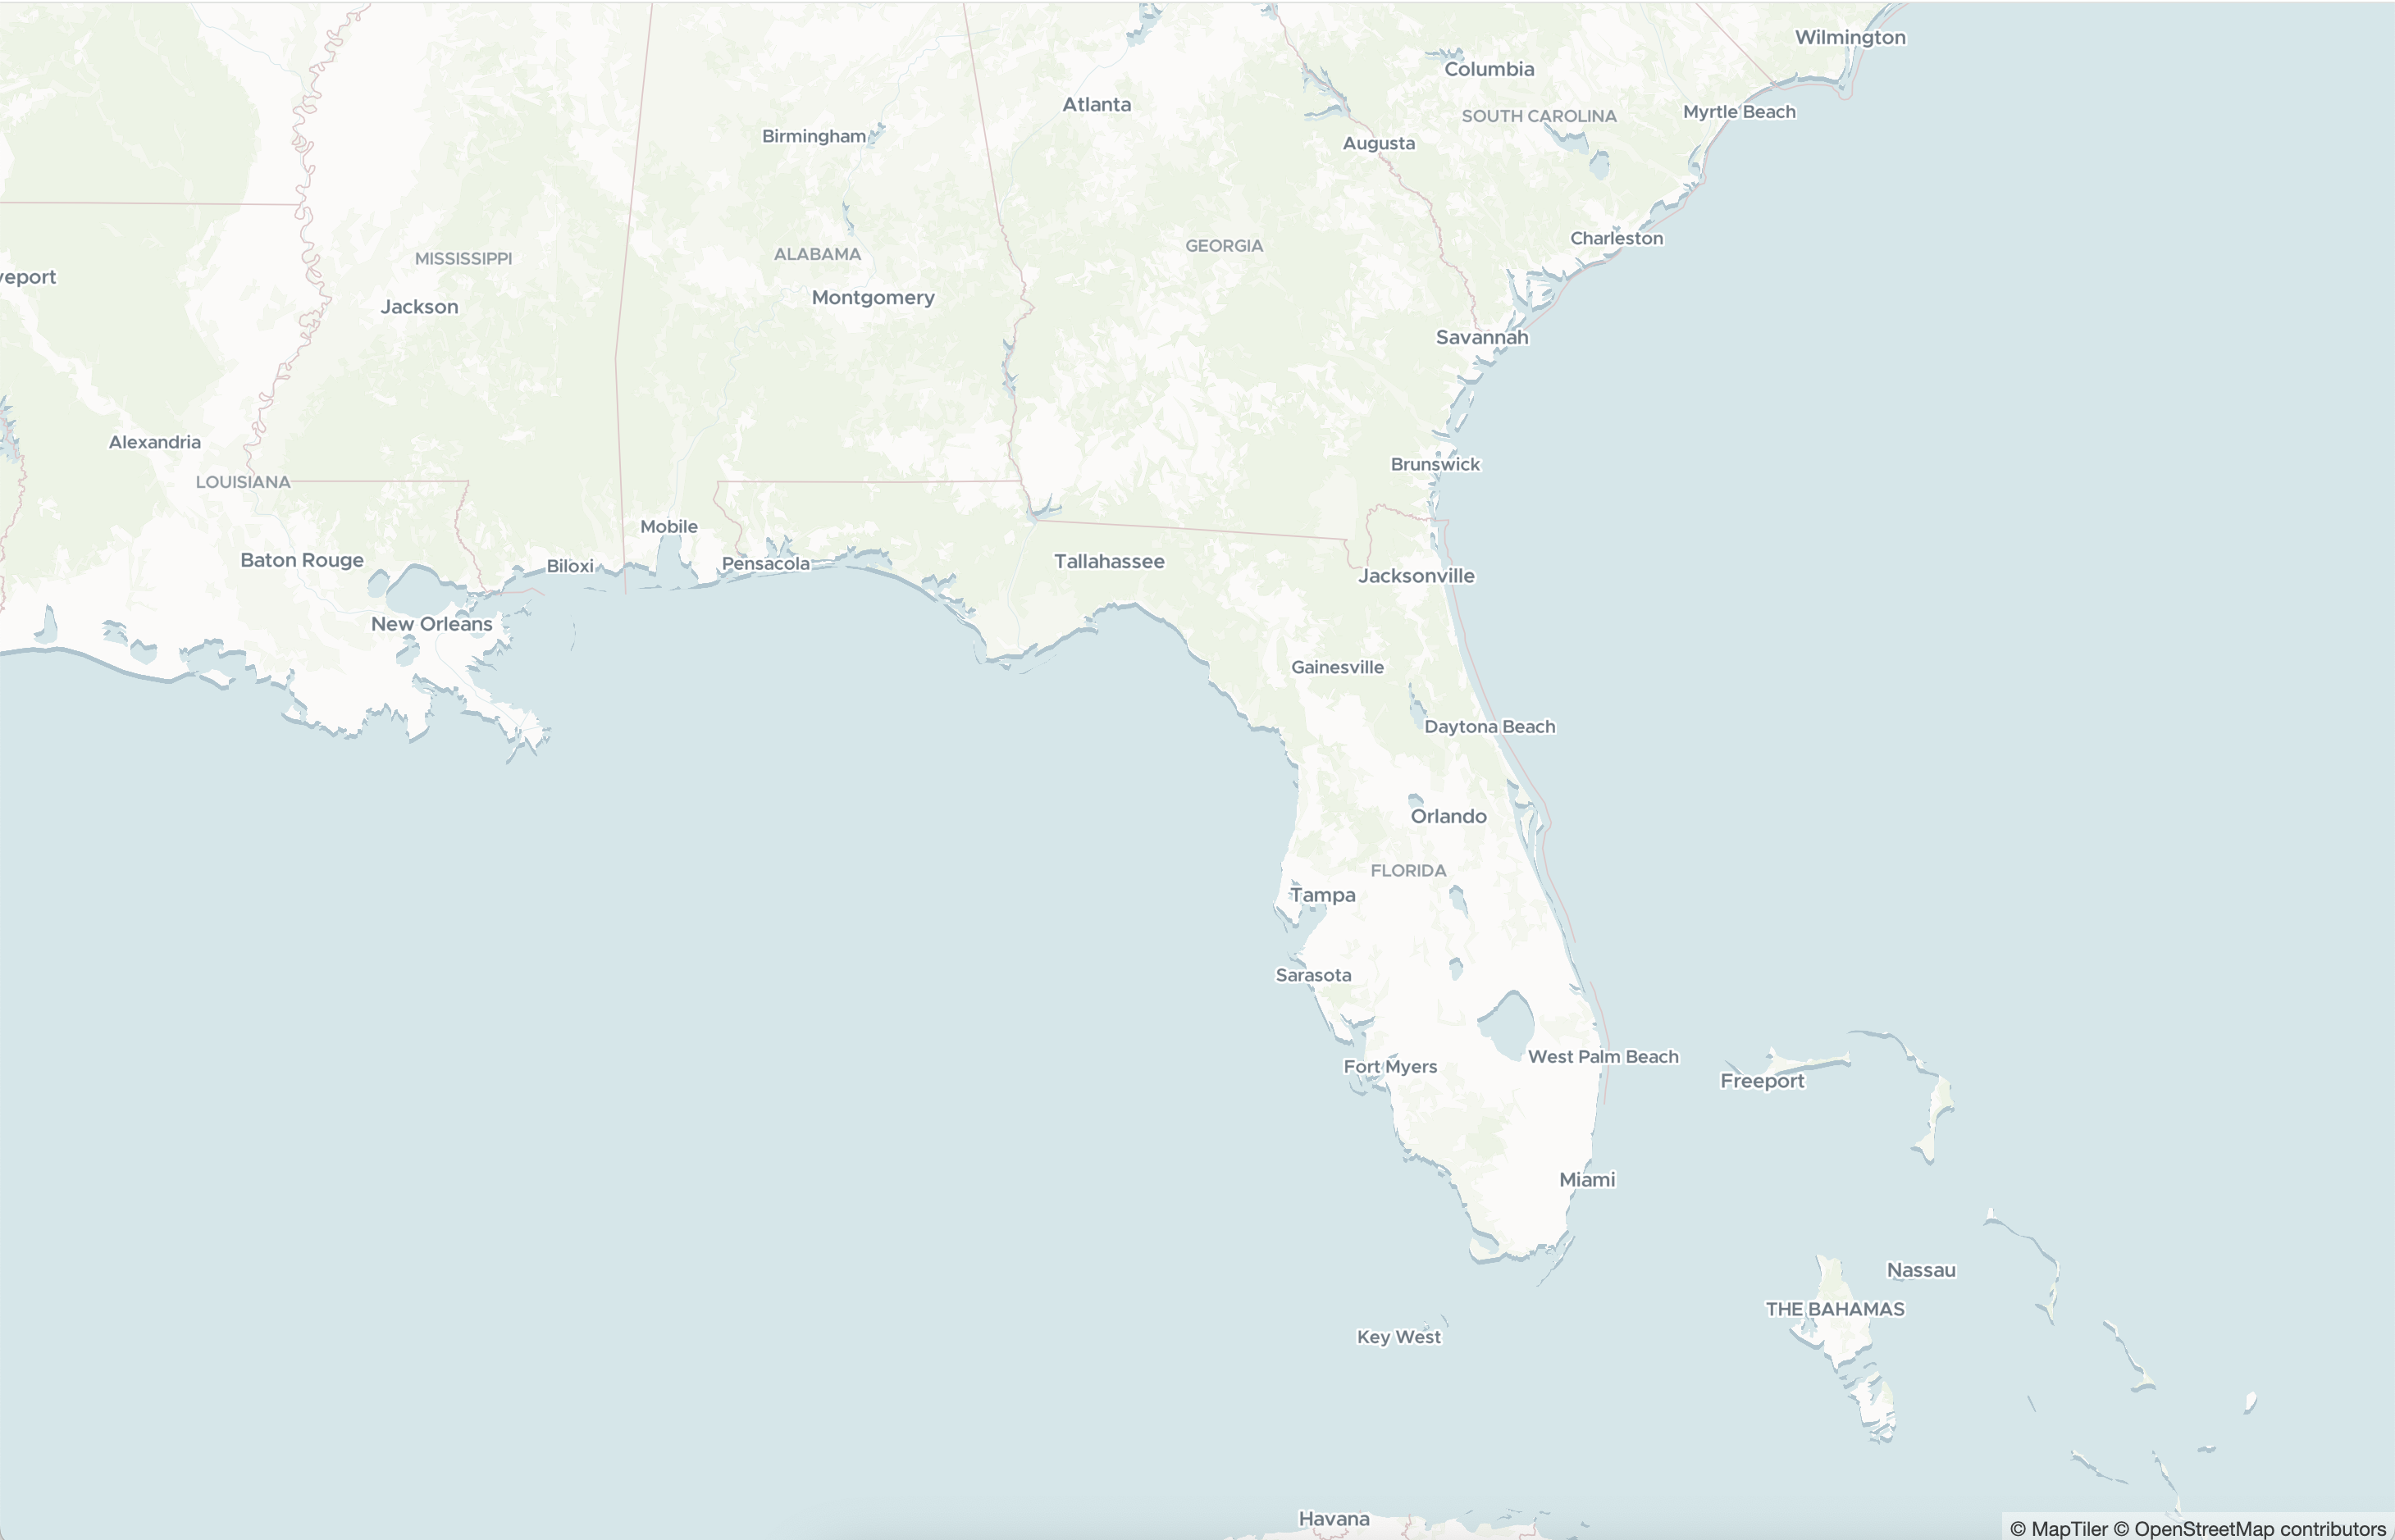
You can easily use Leaflet, Google Maps, ESRI’s toolkit, or Mapbox as your base map. The choice is yours, allowing for a customized foundation for your weather data visualization.
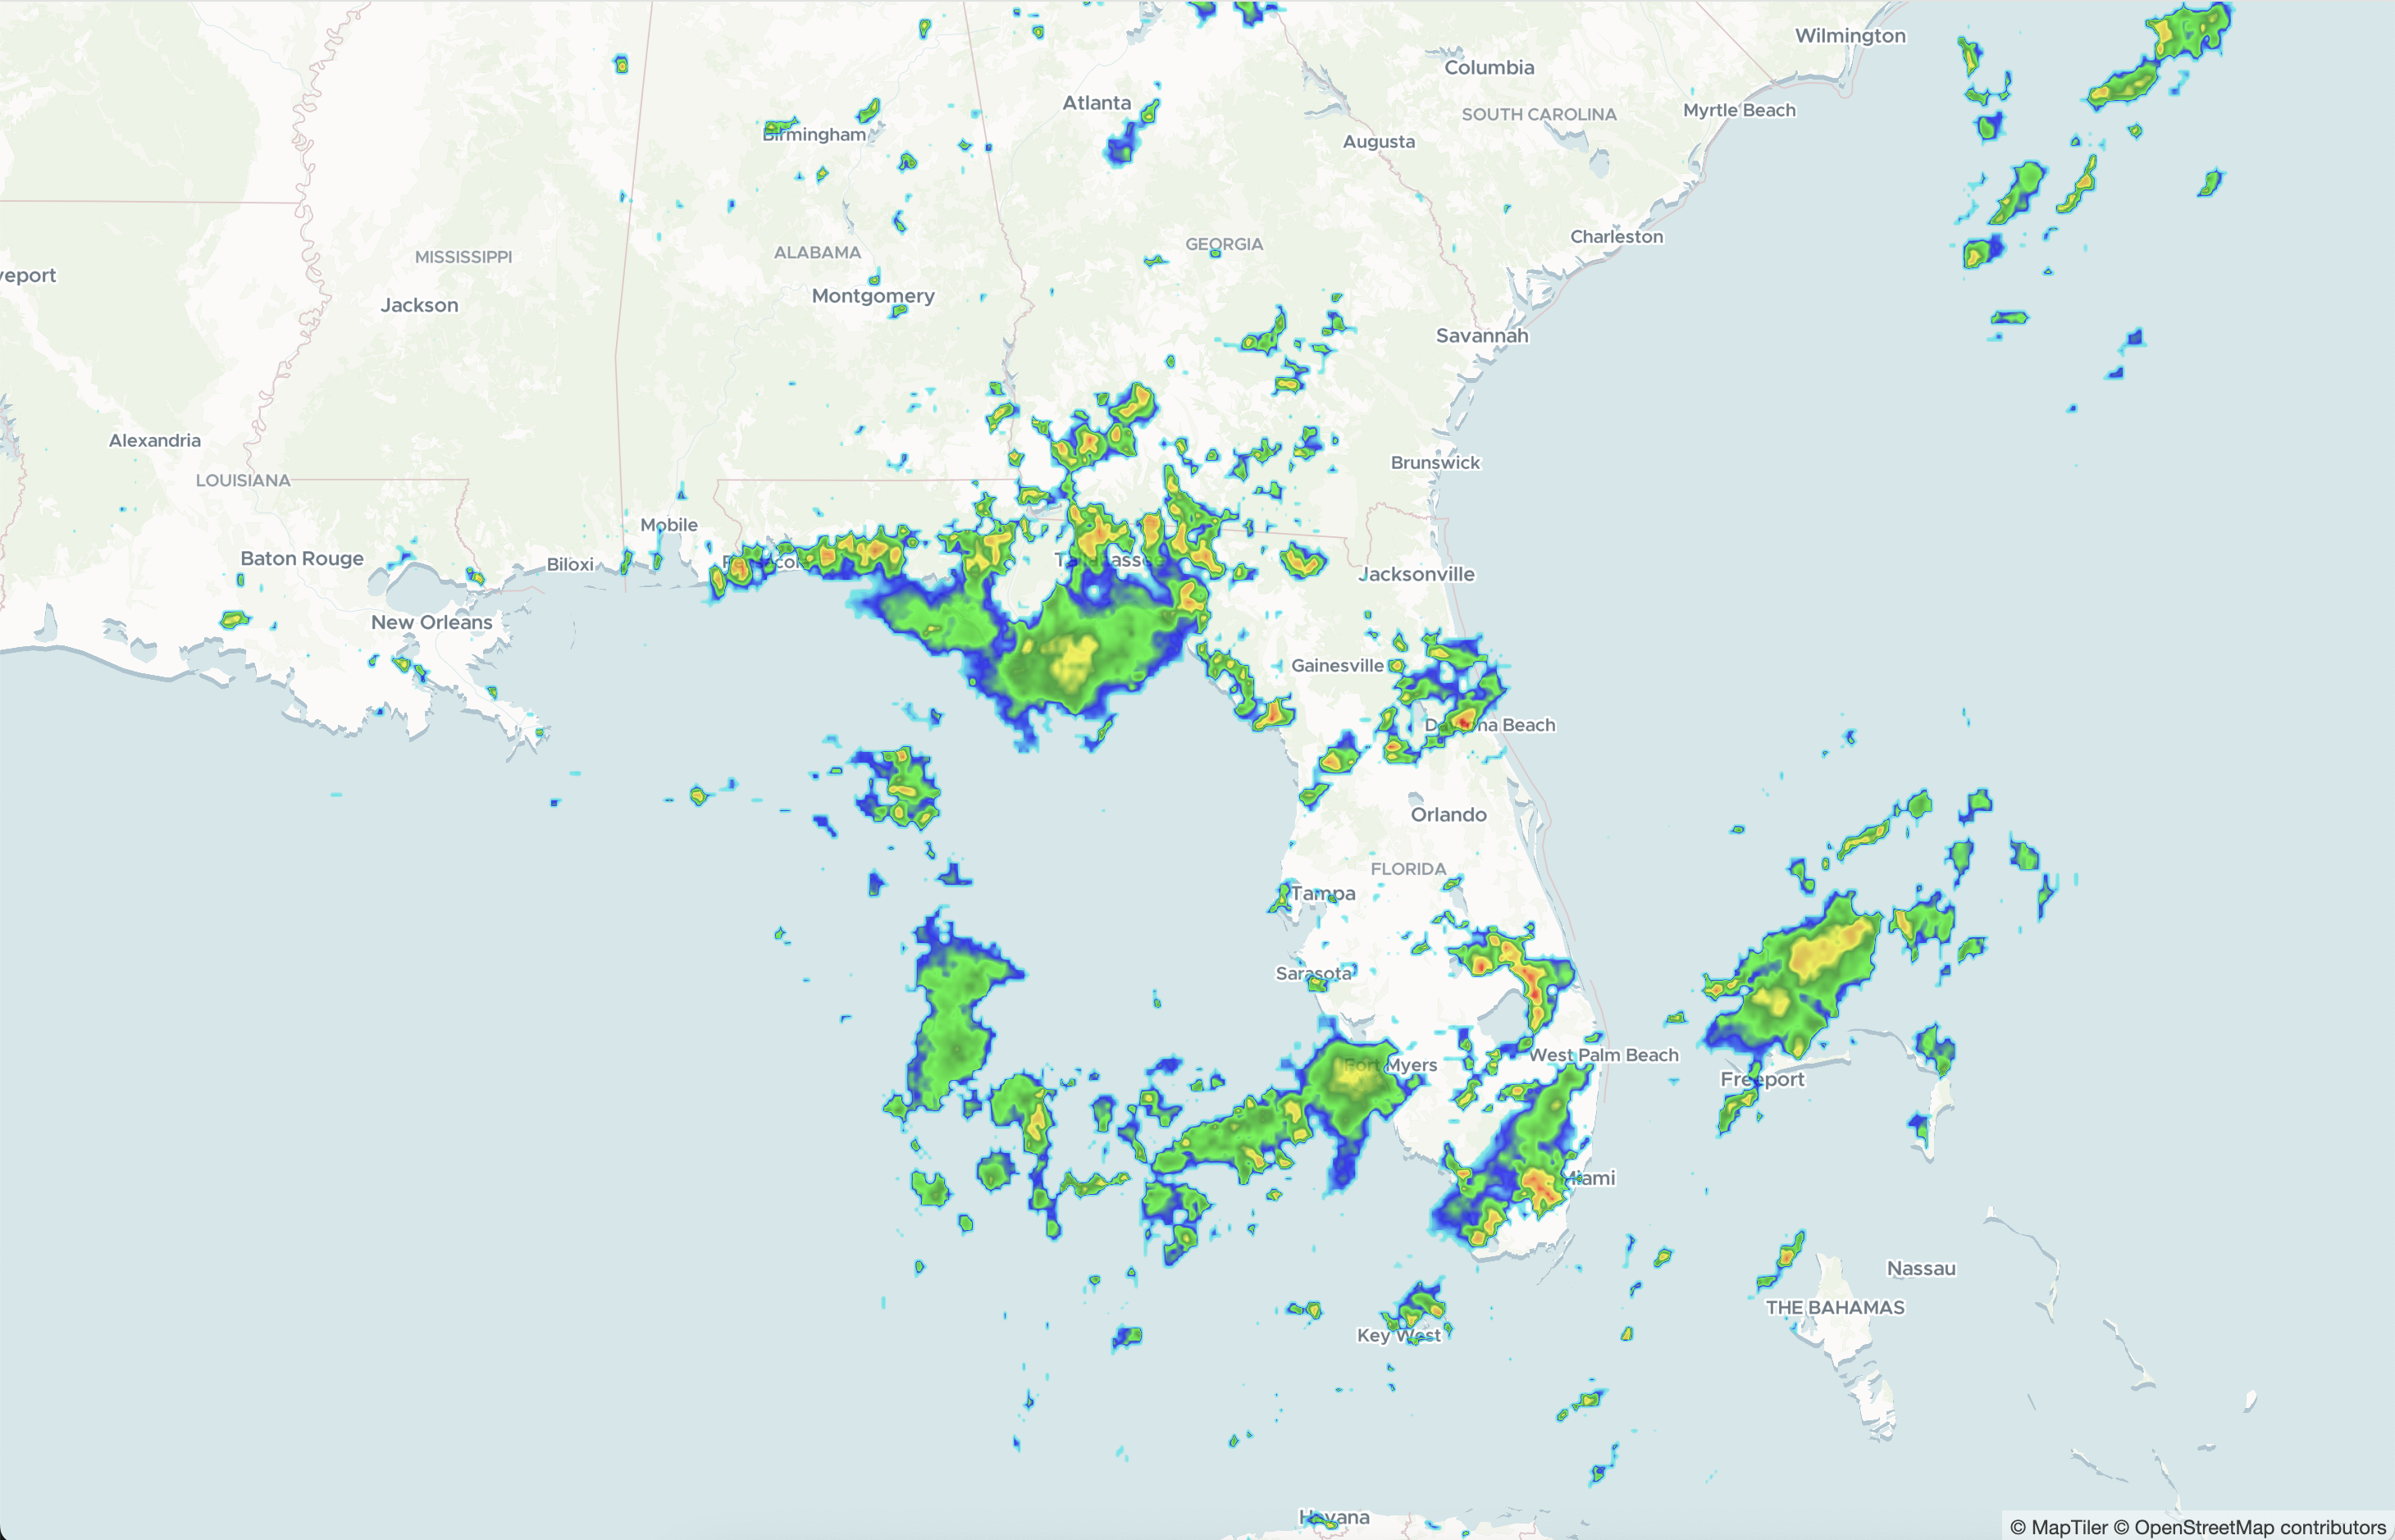
We added the Terrier layer on top of that. It’s Terrier that efficiently and beautifully displays data from our back end, Boxer.
Terrier Web SDK
In this case, Terrier is displaying radar data, but it could be temperature, pressure, wind, cloud ceiling, or any of a host of other variables. Terrier is our special sauce, which does amazing things with its data. But it does them on top of another map.
That’s a common integration point for customers who already have a dashboard. They’ll take Terrier and insert it as a layer in their dashboard. If they were using MapLibreGL, that would look like this.
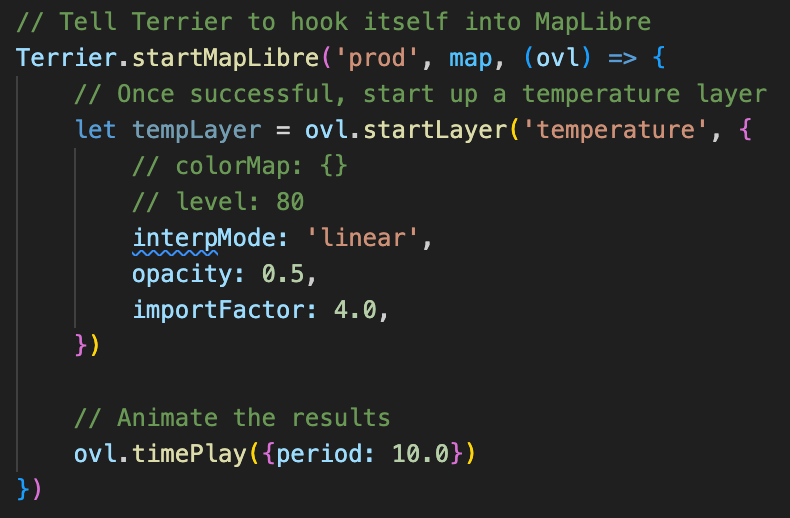
Leaflet and the rest look about the same. You pass in the handle for your map, and Terrier figures out how to put itself on top or insert itself in as a layer. The rest specifies what you want to see.
If you’d like your data layer to look different, you can modify that color map in real time—a bit like this.

Data values map to colors, including an alpha component. This process is convenient for data like reflectivity, where you may want to cut off display below a certain threshold.
That’s how you use Terrier for your weather dashboard integration. If you want to start from scratch, you can use our React app. It has some nice pieces.
Key Components of Weather Dashboard Integration
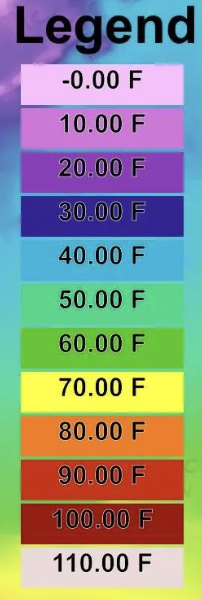
Dashboard: Legend
The legend on the left in the initial image is a React module that turns our TrrShaderColorMap into a simple Legend. There’s a bit of unit control and some ability to make entries disappear (useful for reflectivity).

Dashboard: Media Control
Terrier views its data as individual sources with distinct coordinate systems and irregular time slices. To determine what to display, you tell it what time it is.
If you’d like Terrier to animate over time seamlessly, there’s also an animation mode. It’s more complex than it seems, and it will call you back periodically to update your time display if you have one.
Developers can also change or update the time range on the fly, which can get tricky. We recommend you look at our Media Control to see how it works and borrow the pieces that suit you. Or don’t.

Dashboard: Data Layer Menu
The drop-down menu in our dashboard app is meant to be simple and very expandable. Most developers will just do their own thing here, and we encourage that. Our data layers respond to changes in state quickly, and there’s no real complexity in these menus.
Customizing Your Weather Dashboard
Remember, your weather dashboard integration doesn’t have to mirror our default setup. Terrier’s beauty lies in its flexibility. You can modify data colors, incorporate elements from our React app, or develop your low-level JavaScript display from scratch.
Terrier is designed to accommodate various levels of integration. Whether you prefer working at the JavaScript level for granular control or leveraging React to utilize components from our dashboard app, the choice is yours. This adaptability ensures you can tailor your dashboard to your needs and preferences.
In the end, successful weather dashboard integration is about creating a solution that works best for your unique requirements. Terrier provides the tools and flexibility to make that happen, allowing you to craft a weather visualization experience that’s truly your own.
