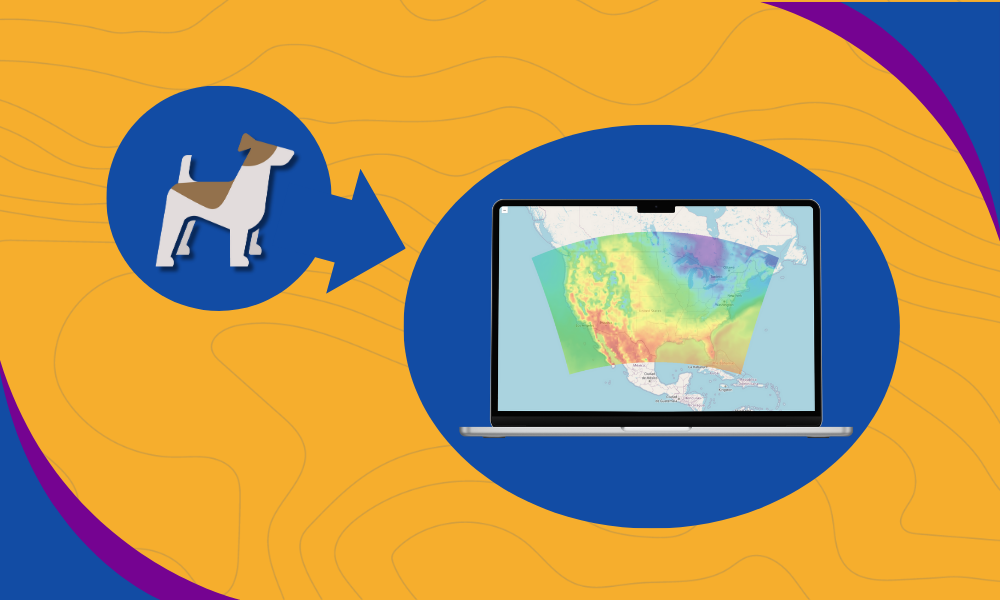
With Terrier, we support weather data display on the web and mobile devices. Weather data is inherently spatial, so we need a map to accompany it. OpenLayers integration provides the perfect solution for combining powerful mapping capabilities with our weather visualization tools rather than building our own mapping system from scratch. We support whatever mapping platform our customers are using.
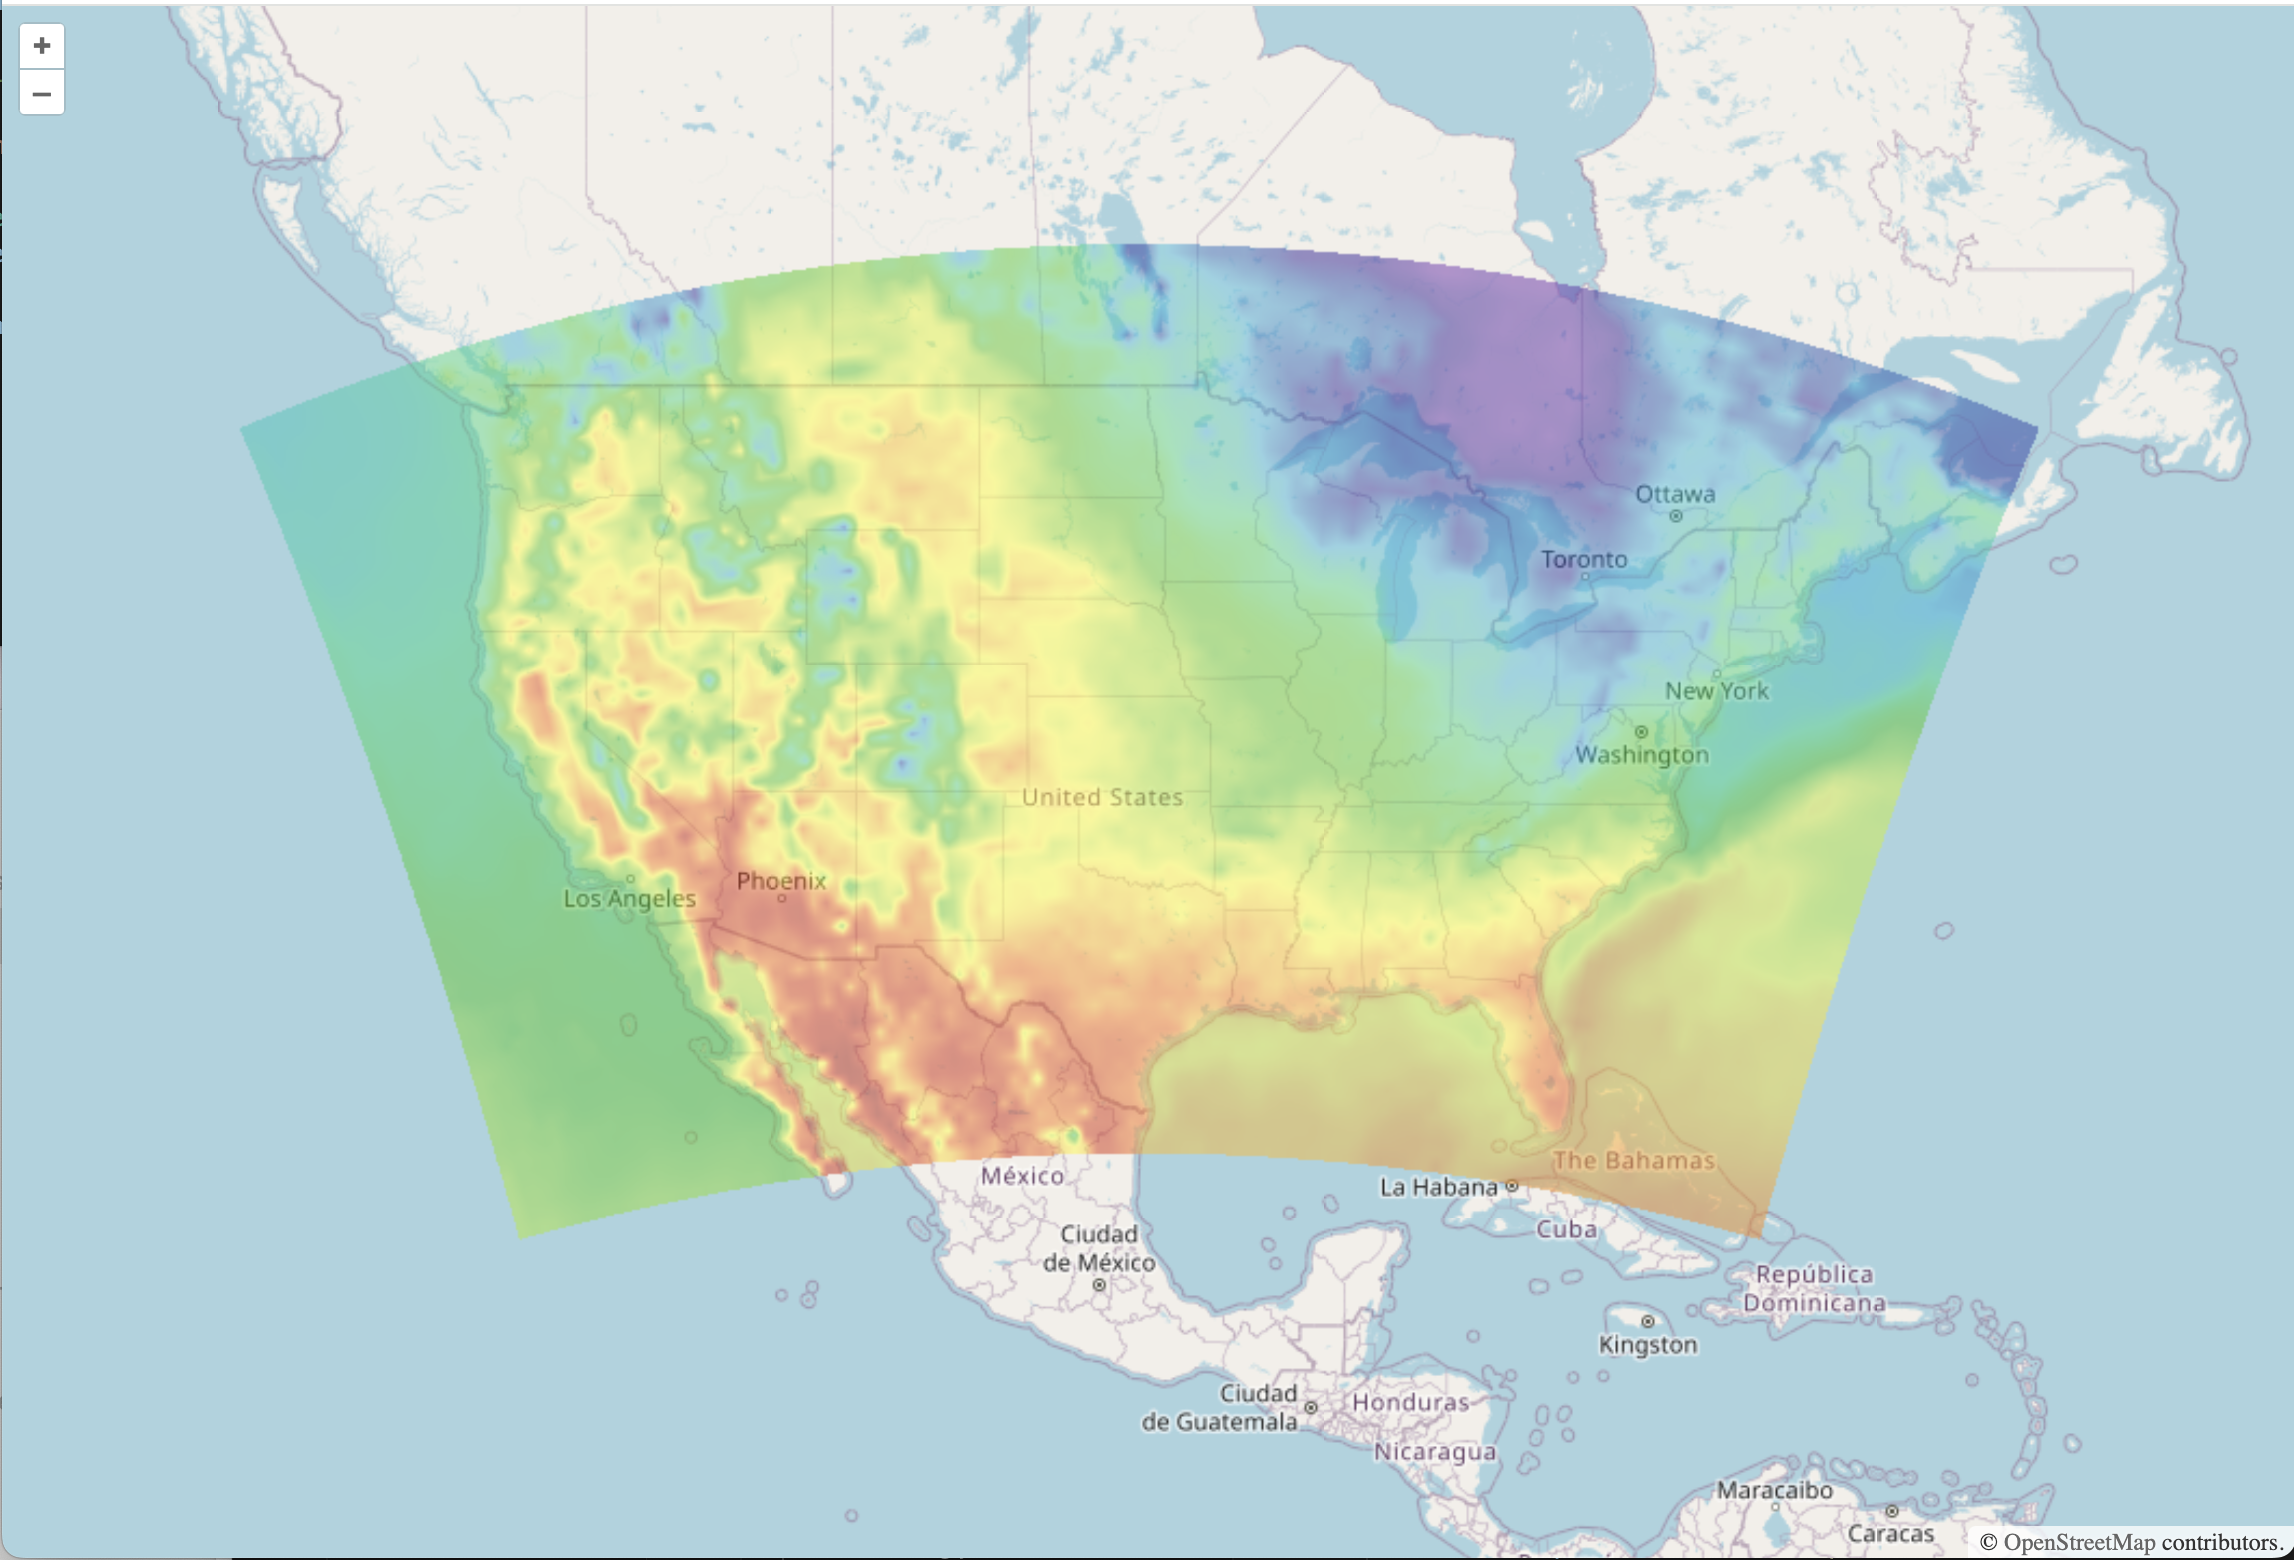
We have a customer who uses OpenLayers, so we now support OpenLayers integration to deliver seamless weather data visualization.
OpenLayers Integration
We start with a simple map using OpenStreetMap image tiles on the OpenLayers side. We’ll also create a canvasLayer to use as a shim to get our weather visualization tool, Terrier, into the middle of the map.
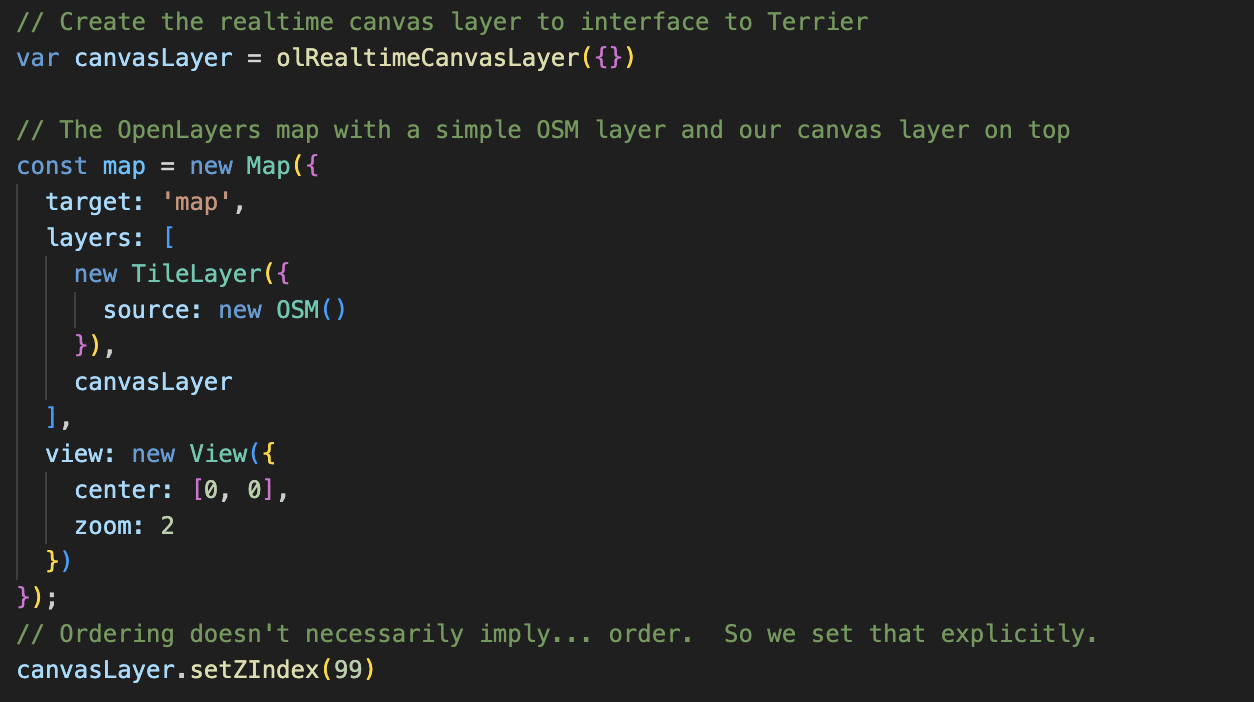
This process gives us an HTML Canvas that acts as a blank map layer on which we can draw. We’ll use that within Terrier to do our WebGL-based weather rendering. Once we have the basics, we can start up Terrier.
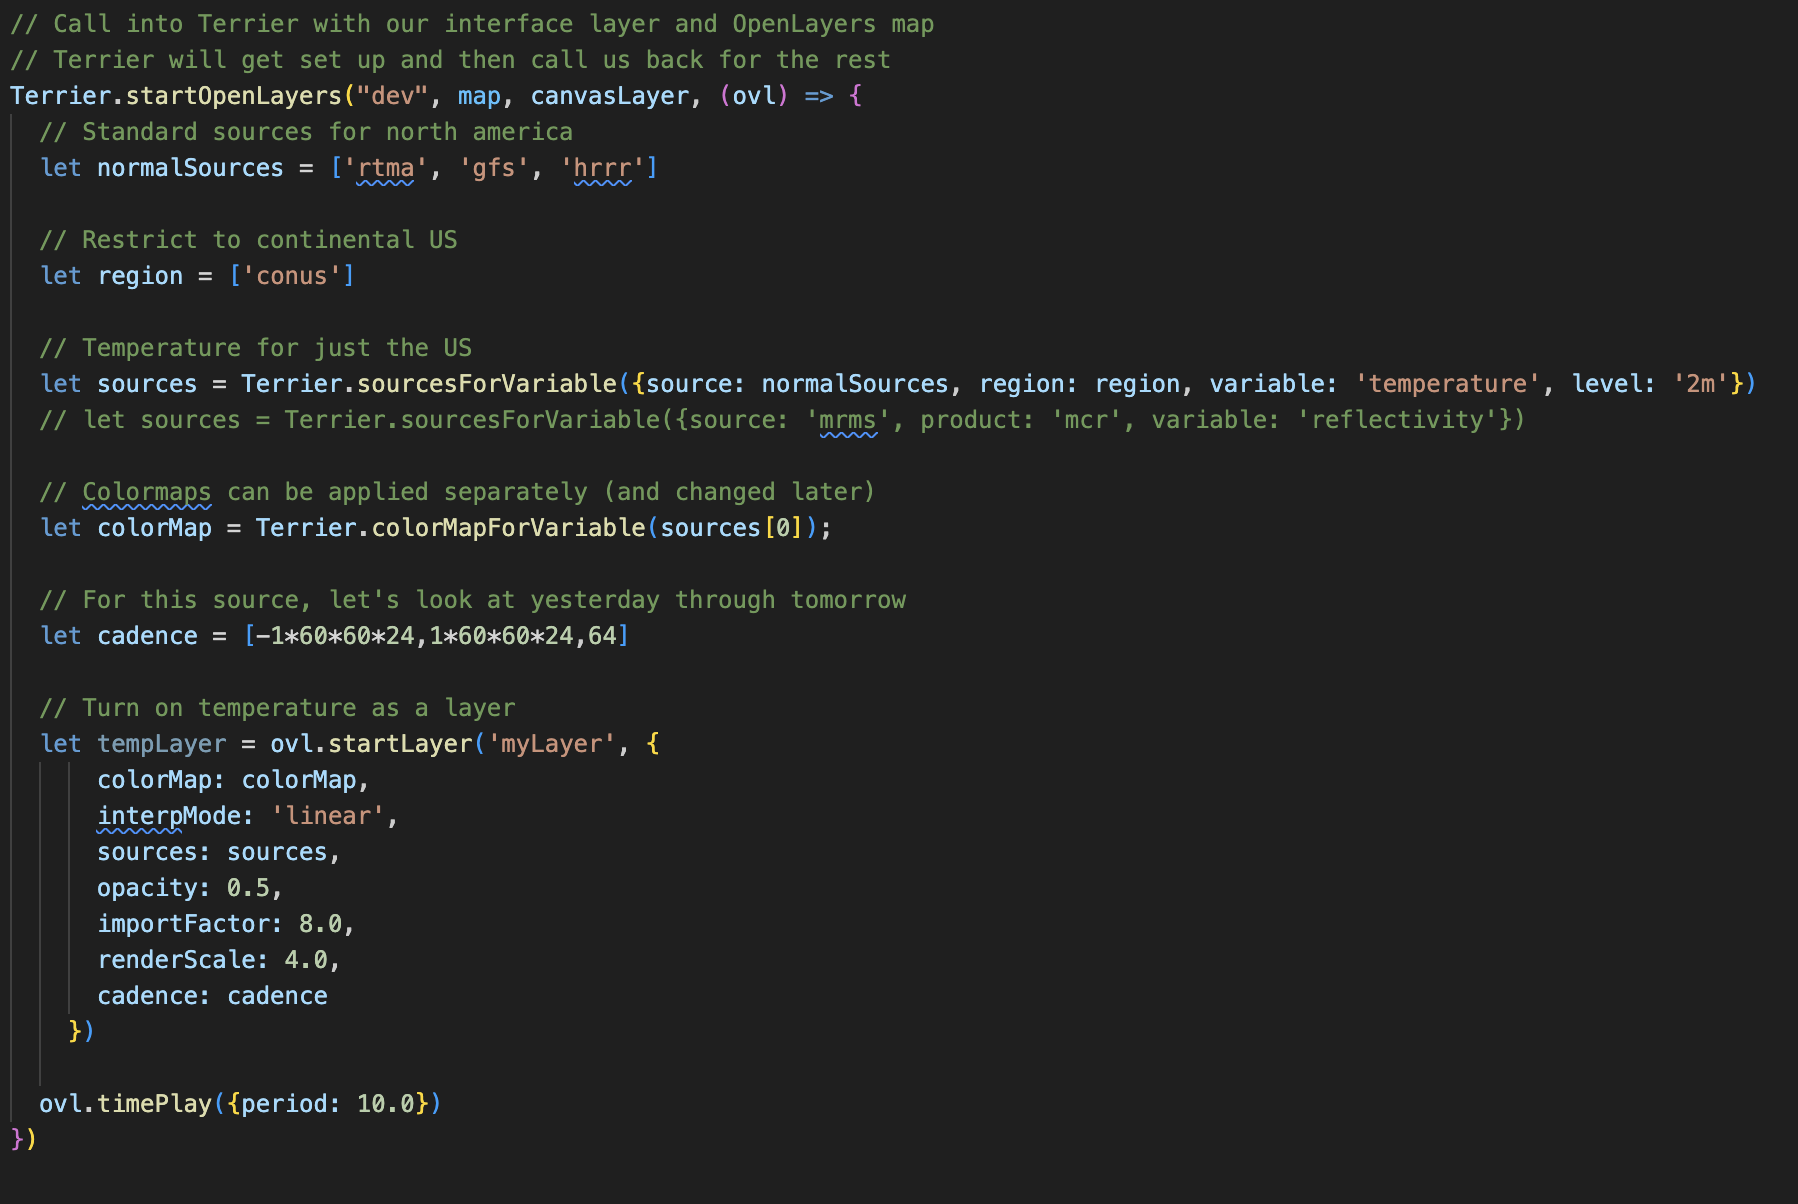
Most of this code is the same, no matter what web map toolkit you use. The main difference is the startOpenLayers() call, which will call us back when it succeeds. At that point, we can display any Terrier layer we like. The OpenLayers integration makes this process straightforward and reliable.
How OpenLayers Integration Works
OpenLayers is more of a traditional web map toolkit, like Leaflet. OL is older than Leaflet, and its complexity may have inspired its development. Suffice it to say that OpenLayers is a complex and venerable toolkit.
Adding support for Terrier was easy. Our OpenLayers integration approach is intuitive because OpenLayers thinks about maps the same way we do, so it was just a matter of building a projection matrix to match the current view. We track our own view with theirs, which makes us a 100% match with the current display. Add in a bit of animation control for when we’re animating weather, and we’re off.
OpenLayers doesn’t have a single core rendering loop for WebGL, preferring to keep each layer independent. This dovetailed nicely with our Leaflet support, where we draw our data to an HTML Canvas backed by WebGL. The same trick worked here, making our OpenLayers integration particularly efficient.
How OpenLayers Integration Looks
The rendering is seamless, with no hesitation between the map and the weather data, even when zooming. This demonstrates how well our OpenLayers integration performs under various conditions.
This should work great if you’re an OpenLayers user and one of our customers.
Taking Weather Visualization to the Next Level
Terrier’s OpenLayers integration enhances weather data visualization, making it easier for organizations using this mapping framework. This seamless connection between OpenLayers and Terrier’s rendering provides a professional experience that meets customer expectations. Whether tracking storms or analyzing climate patterns, our integration ensures precision and visual clarity.
