We’ve been moving our customers to the new version of our visualization interface, Terrier2, powered by our cloud service, Boxer2. The Terrier visualization system offers unprecedented flexibility and scalability, with expanded data access for our customers. Let’s explore what’s new in Terrier.
First, a Boxer2 Update
Boxer1 was our cloud data processing system, which directly fed our customers’ data visualization needs. When an importer obtained a new time slice for a variable, it reworked that data for Terrier’s use, and then it was done.
We’ve changed that quite a bit with Boxer2. Now, the importer’s only job is to rip variables out of their import data files (ideally NetCDF, but probably GRIB2), convert each to Zarr, and toss them into the pool for further processing.
The Zarr is immediately available for query with Labrador and WCS but will go through a bit more processing for the visual side. We have our quasi-visual format to feed Terrier, and then we make a version for the OGC standards like WMTS and WMS.
For legacy visualization systems, we maintain WMTS and WMS-compatible versions. Though these take considerable processing time, Terrier visualization technology isn’t subject to those limitations, but we maintain WMS and WMTS for backward compatibility.
In any case, the data will exist in several different forms, each version appropriate to its own use. For Terrier, it’s a matter of asking for what it needs.
Advanced Terrier Visualization Filtering
The original Terrier1 had hard-wired displayable data, requiring toolkit updates for each new data type. Our new Terrier visualization interface eliminates this constraint entirely.
Terrier2 asks a given stack what data it has available when Terrier starts up. That returns a huge list of possibilities, and we’ve added some methods to filter that down. Here’s how a Terrier2 Javascript user might ask for radar data:

This will filter down to just composite reflectivity from MRMS for the continental US. If you weren’t this specific, you might get base reflectivity or even derived reflectivity from one of the models. The latter is nice for comparing rainfall estimates with active radar.
Terrier Visualization: Colormaps
Our Terrier visualization system now includes numerous new layers, particularly for radar, with corresponding colormaps. But choosing which can be tricky, we find in our own dashboard.
To make that easier, we added a new method that’ll make a best guess for you:
Make sure you have at least one source, of course, but it will look at the variable, dataType, and a few other values to give you a plausible colormap for your variable.
If you have a colormap you like, you can just build it directly like so:

How Much Data and for How Long?
Boxer has an enormous amount of data available, and you need to narrow it down. You can do that with a cadence like this:

This one says we’ll go back a day, forward a day, for a maximum of 64 frames. That last one is incidentally per source, so be aware of your memory footprint. Though Terrier can handle more data than you might think.
Implementing Terrier Visualization
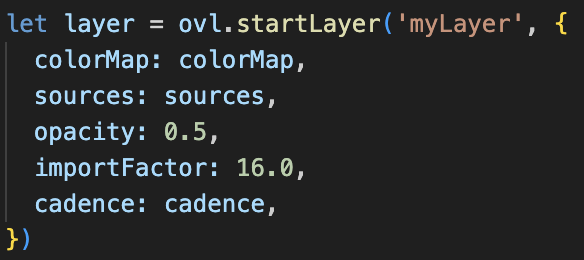
The last step to implement your Terrier visualization layer hasn’t changed too much from the previous version:

Putting all these together will display just the data sources you want over the period you care about.
Terrier2 is much more precise about what data you want to display. That pairs nicely with the expanding data sources available in Boxer2, letting users drill down into exactly what they want to see.
The Future of Terrier Visualization
The precision and control offered by Terrier visualization make it the perfect front-end for accessing our expanded data sources, but the flexibility truly sets it apart. Whether you’re working with radar data, meteorological models, or new data types we haven’t even conceived yet, Terrier2’s architecture is ready to handle it.
As data sources expand and visualization needs become more complex, Terrier2’s adaptable architecture ensures you’ll be ready for whatever comes next. It never hurts to be specific, but with Terrier2, you can be both specific and flexible—exactly what modern visualization demands.

