We do some pretty advanced data visualization for weather data. Our Terrier is interactive, low latency, and very pretty. There are many moving parts to that, but we’ll let you in on one of our secrets: Our map toolkit integrations use other peoples’ map toolkits on the web.
Integrating those map toolkits can be tricky, but we handle that behind the scenes. You’re in the right place if you’re curious about how we do it.
Integrating Other Peoples’ Map Toolkits
We have a great visualization toolkit of our own called Terrier. In addition to doing the realtime weather display, it can do regular maps. Vector maps, image tile-based maps, you name it. It’s capable, and we use the map functionality on mobile devices.
For the web, we decided to use other people’s maps for the map part of it all. We use yours rather than getting into a big debate about our map display vs. the toolkit you want to use.
Integration with other peoples’ map toolkits can be tricky, so we’ve devised some strategies. It comes down to how their map toolkit is implemented. Did they use WebGL, a Canvas, or is it a very old-school Document Object Model (DOM)? Let’s start with the best case, WebGL.
MapLibre & Mapbox: Proper WebGL Integration
MapboxGL is one of the more popular alternatives to Google Maps. It’s a much more flexible and capable map display toolkit. Google Maps is probably the better map, but MapboxGL is far superior as a toolkit.
MapboxGL was open-source for a long time, but when it became closed-source, the MapLibre toolkit was born from the last open-source branch. As far as integration goes, they’re basically the same.
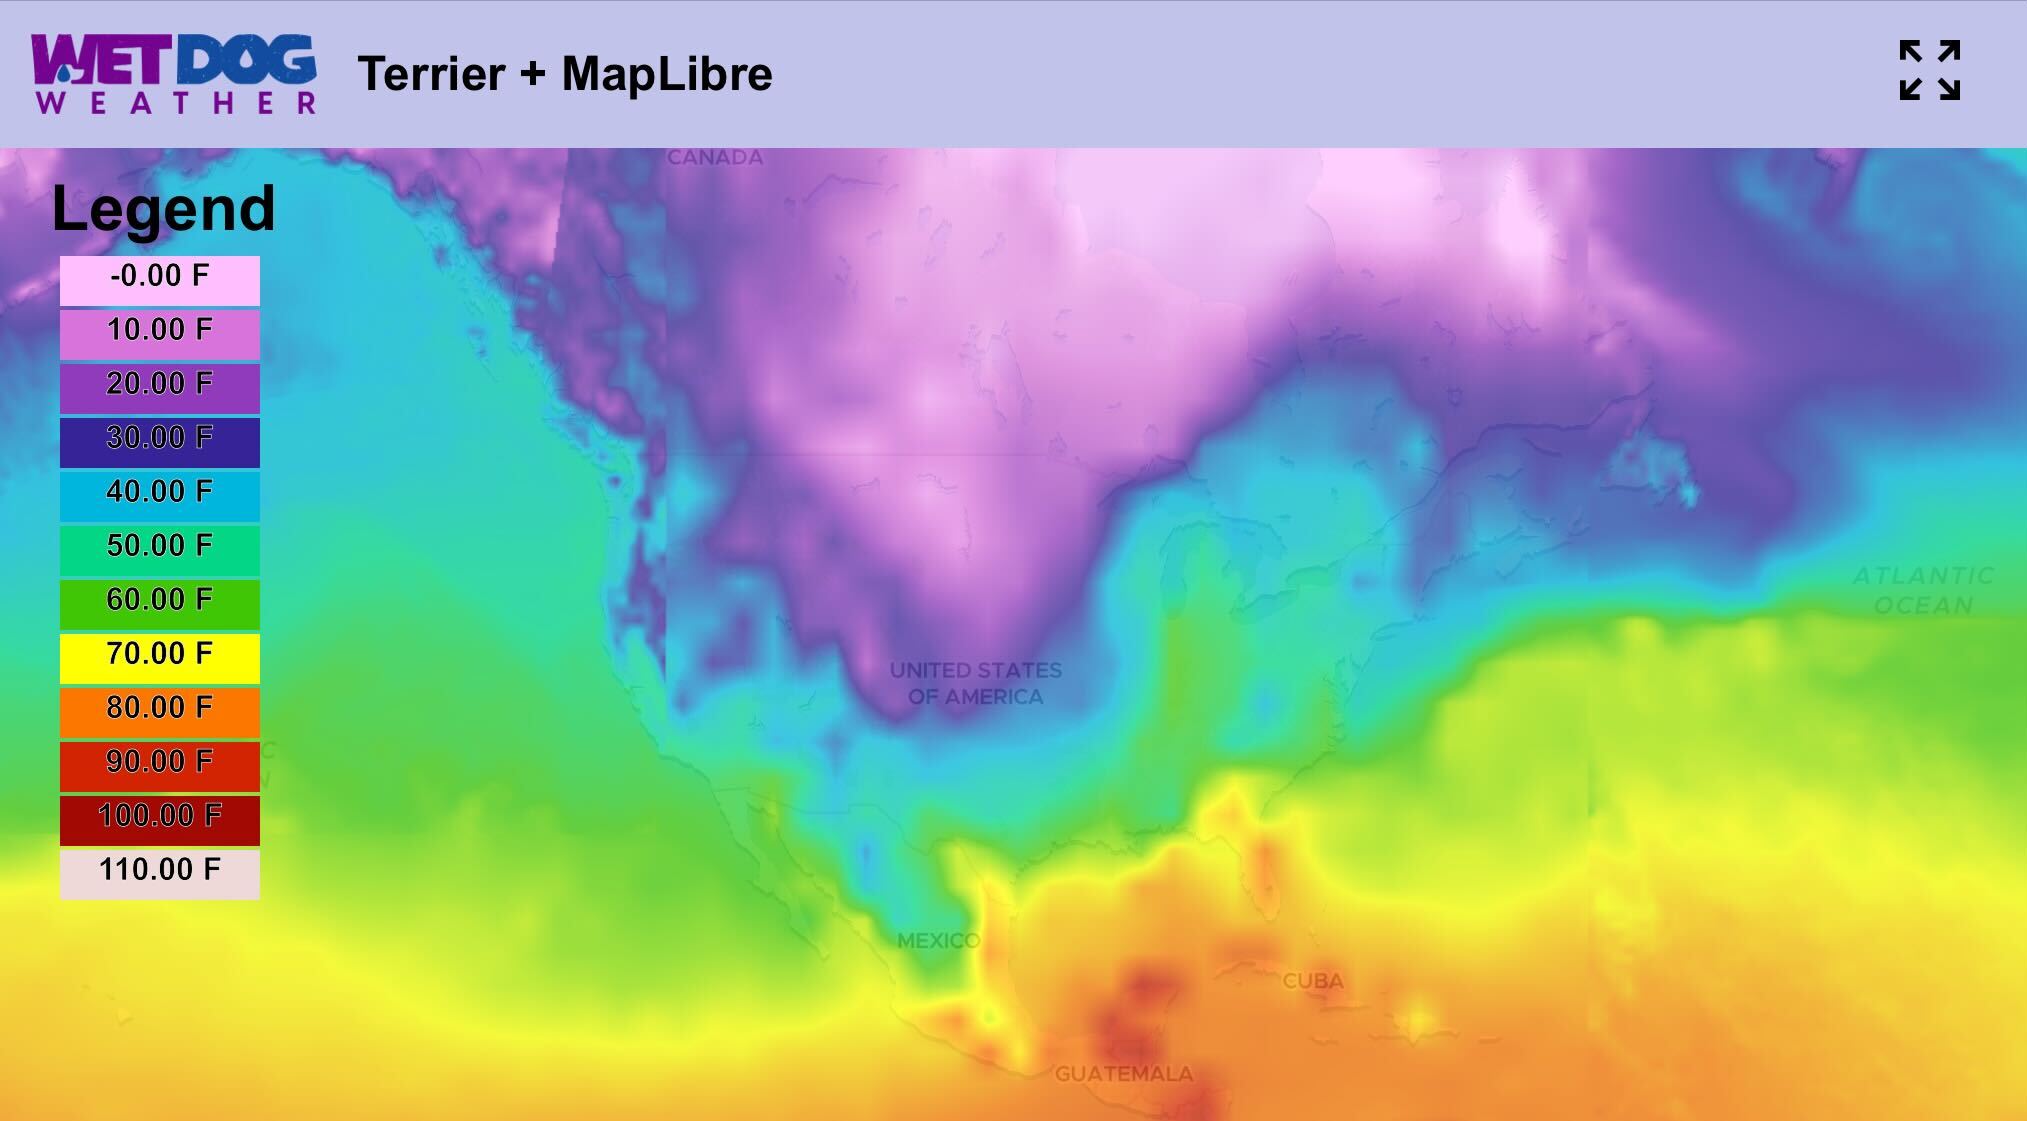
These are WebGL-based toolkits just like Terrier, so all we need is a hook at the right time and just a bit of information about what their map is doing.

How Custom Layer Works
In MapLibre and MapboxGL, the hook is a Custom Layer, a mechanism they added to let you draw whatever you like within the map itself. It consists of four callbacks:
- onAdd: MapLibre is ready to add your new layer
- onRemove: MapLibre wants to remove your layer
- prerender: sets up data structures before rendering
- render: it’s time to do your rendering
It’s the onAdd call where we set up our basic parameters, including the WebGL canvas we’ll use and map projection for Terrier. Terrier can work in various coordinate systems. However, MapLibre is purely a web Mercator, so that’s relatively easy to set up.
Render Call
For each frame, what we need to know from MapLibre comes in the render call, and we’ll gather the following information:
- Canvas width and height
- Current map center and zoom level
- Tile Size because these toolkits are very tile-obsessed
- Full projection matrix from the Mercator coordinate system to rendering space
MapLibre Integration
From that information, we can transform to Terrier’s view of the world and get a one-on-one match. This process works great in 2D and even with their hybrid 3D mode. It allows us to track perfectly with no frame delay.
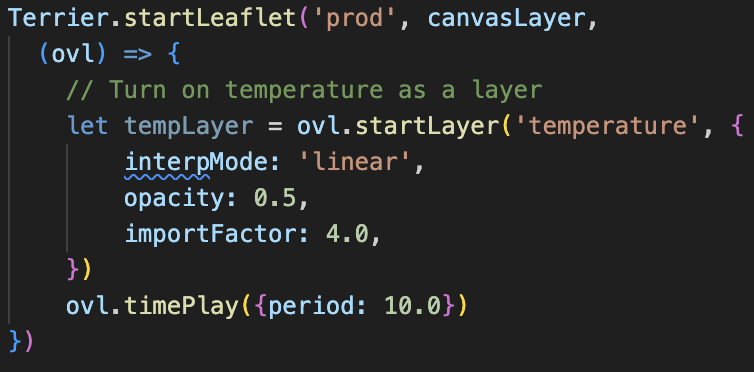
We hide all this, of course, and integration looks like this from the developer’s perspective.

That’s the best case, so let’s look at a more difficult one.
Leaflet: A Web Overlay Approach
Leaflet is a great map toolkit, but from a very different perspective. It is small and nimble and speaks the language of web browsers: DOM. Where the more modern map toolkits say, ‘Step aside and let us handle this,’ Leaflet builds its map from web-native components.
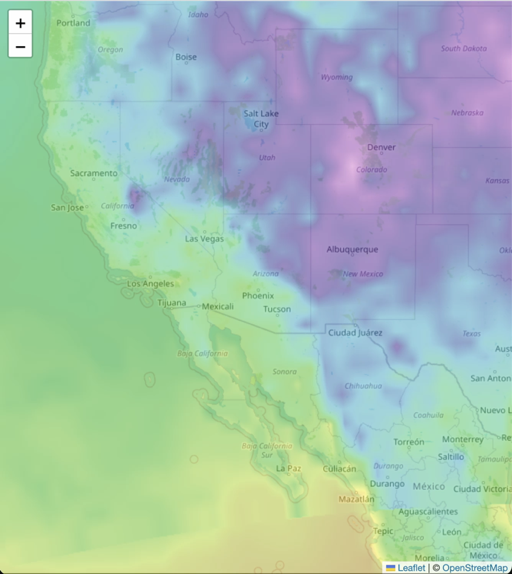
With Leaflet, we don’t have any WebGL renderer we can hook into, so we have to overlay Terrier on top of Leaflet and track its movements closely.
Setting Up WebGL Canvas

The first thing we do is set up our own WebGL Canvas to give us the WebGL context we need to draw into. We insert this into the DOM on top of the Leaflet objects. Then, we’ll set up a render callback we can use when it’s time to draw what Terrier is up to. We’ll need that later.
Since Leaflet does not have a simple ‘draw now’ hook, we must set up a more complex harness to track its actions. Thus, the RealTimeCanvas layer is based on Stanislav Sumbera’s Canvas Layer.
The existing Canvas Layer was meant to draw on top of Leaflet. Drawing them on top of Leaflet using Canvas is possible if you have geospatial overlays and can work out the math. That’s what we want to do, but our realtime overlay has more constraints.
RealtimeCanvasLayer
RealtimeCanvasLayer does two crucial things beyond what the CanvasLayer would typically do. First, it teases out the map math to pass over to Terrier. These numbers include:
- Leaflet map center in Web Mercator
- Leaflet zoom level
- Canvas size
We can calculate what we want from those numbers, such as a proper projection matrix, and use that in Terrier. Then, we can track Leaflet as it moves around. Zooming is more complicated.
The second thing the RealTimeCanvasLayer does is manage the frame rendering. We render when Leaflet tells us to drawLayer, but we’ll also need to do it as we load data and animate it over time. We also need to watch for Leaflet actions, such as zooming.
Leaflet isn’t aware of any of that, so we have to hook ourselves into the browser window’s vertical sync callback. We want to draw at the right time to get the timing right rather than keeping an old frame around. This process is vital for animation.
Leaflet Integration
It’s an extremely fiddly process because we want it to be unobtrusive when nothing is happening. Terrier’s steady state is low resource usage when paused, so much of the logic in RealTimeCanvasLayer revolves around starting callbacks and shutting them off when not needed.
The developer sees none of that, and integration looks like this.

The Utility of Being Map Toolkit Agnostic & Other Toolkits
Taking a map-agnostic approach has been fruitful. We might have debated features with a customer before, but now we adopt their favorite map technology. It’s also opened our eyes to the utility of a DOM or Canvas-based map.
We’ve looked at other toolkits beyond those first two and have yet to find an impossible case.
- We tested an integration for Google Maps but have not had any users.
- OpenLayers has a WebGL mode, which should be easy to use.
- ESRI’s more modern map display toolkit is based on WebGL and has the hooks we need.
We can integrate directly with WebGL-based maps while we use an overlay-based approach for the others. It’s been an interesting journey, and we hope to add more integrations.

